

Introductory
Call
Call
This 15-minute call determines if property investment aligns with your financial goals. If it's a match, we'll book a Discovery session. If not, we'll guide you on your next steps.
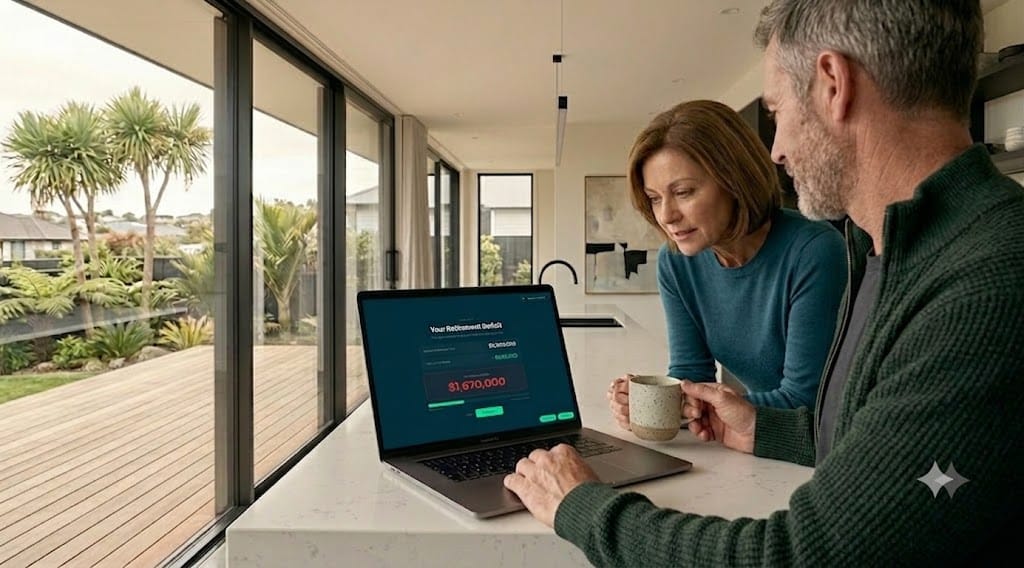
Step 1:
Discovery Call
Discovery Call
In this 45-60 minute video call, we'll review your finances and goals to map out your retirement "gap." You'll leave with a clear retirement plan based on your financial reality.

Step 2:
How-To Meeting
How-To Meeting
This 45-60 minute session demonstrates how a tailored property strategy can close your retirement gap. We'll cover key concepts and show you what a personalised portfolio could look like.
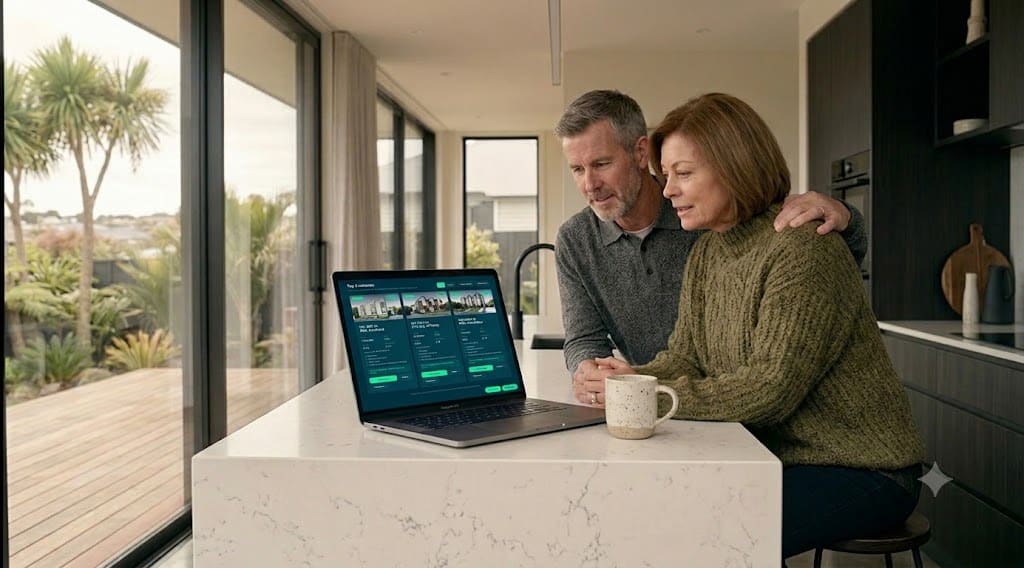
Step 3:
Asset Selection
Asset Selection
In this 60-minute meeting, we present three data-backed investment options tailored to your profile. After reviewing cash flow forecasts and answering your questions, you can select a property with confidence.


How to Start Investing in New Build Property Without Stretching Yourself Too Thin
Many Kiwis want to invest in property but hold back for one simple reason: they’re worried about...

Three Things Every Kiwi Investor Needs Before Buying a New Build
Most people who look into new build investment know they want to build wealth for retirement. They understand...

Fixed-Price Contracts and Turnkey New Builds: What Every Kiwi Investor Needs to Know Before They Sign
Buying a new build investment property sounds straightforward, until you start digging into the details....

Should You Pay Off Your Home Loan First, or Start Building Your Investment Property Portfolio Now?
For many Kiwis, the idea of carrying debt feels uncomfortable. It makes sense. You’ve worked hard...

How to Choose a Property That Supports Both Cashflow Today and Equity Growth Tomorrow
Investing in property is a cornerstone of wealth creation in New Zealand. For many, it represents the...

Planning for Retirement: How Property Investment Can Secure Your Future
Retirement should be a time of comfort, security, and freedom. Yet, for many New Zealanders, the path...

From One Investment Property to Two: The Habits That Help Investors Scale Safely
Owning one investment property is a significant achievement. It’s your entry into the market and a powerful...

The True Cost of Waiting: Why Delaying Your Property Investment Can Derail Your Financial Future
Waiting for the “perfect moment” to invest in property can feel like a sensible strategy. A property...

A Step-by-Step Guide to the New Build Construction Timeline
Investing in a new build property is an excellent strategy for securing your financial future. Unlike...

How to Calculate Your True ROI on a New Build Investment
Calculating the true Return on Investment (ROI) for a new build property is essential for any investor...

